Trading
There are two options to place orders. In watchlist, “Buy” and “Sell” buttons are provided to place order under Trade column. Alternatively, you can use “Place Order” button available at bottom bar for placing order.
Quick Quote is a unique tool that allows you to quickly check the stock price and place order instantly. Quick Quote is available in separate window so that you can keep tab on rates and place trade without opening your platform window.
There are four types of orders available in the application: Market order, Limit order, Stop loss order and Stop loss market order.
Margin, Cash, Intraday, Encash, Coll-Sell, E-Margin and Cover Order are the product types available in the application for placing your order.
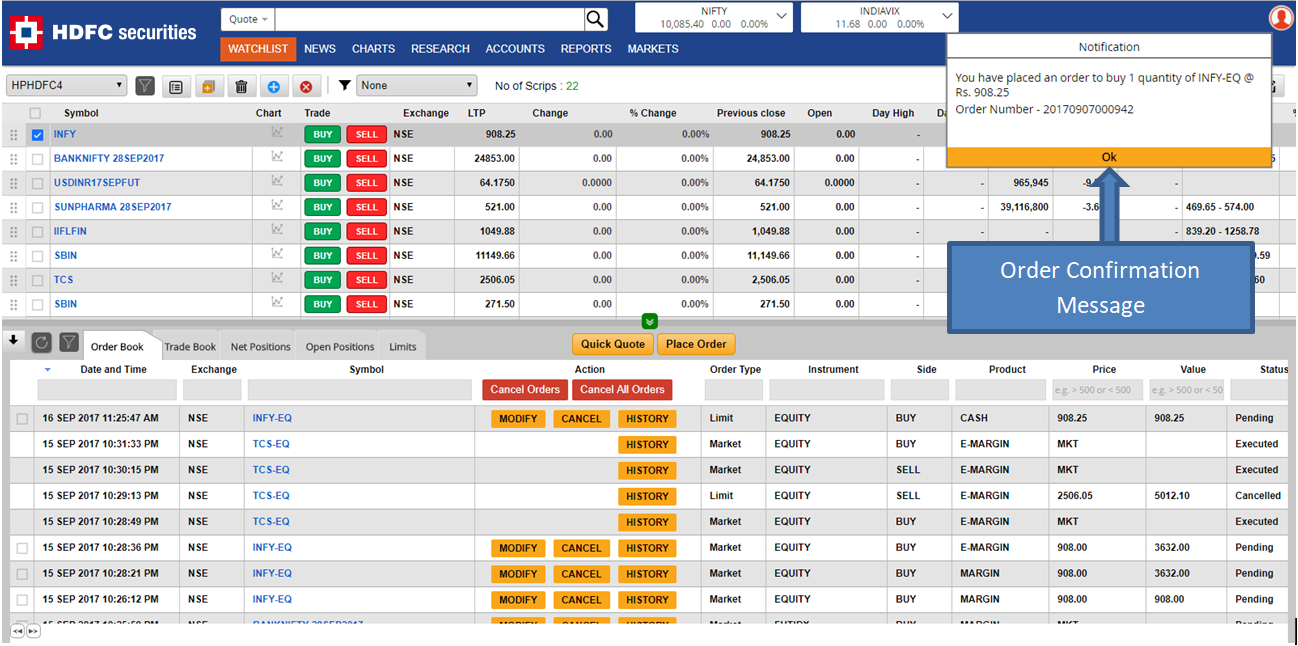
Yes. You will get notification for order confirmation on the top right corner.
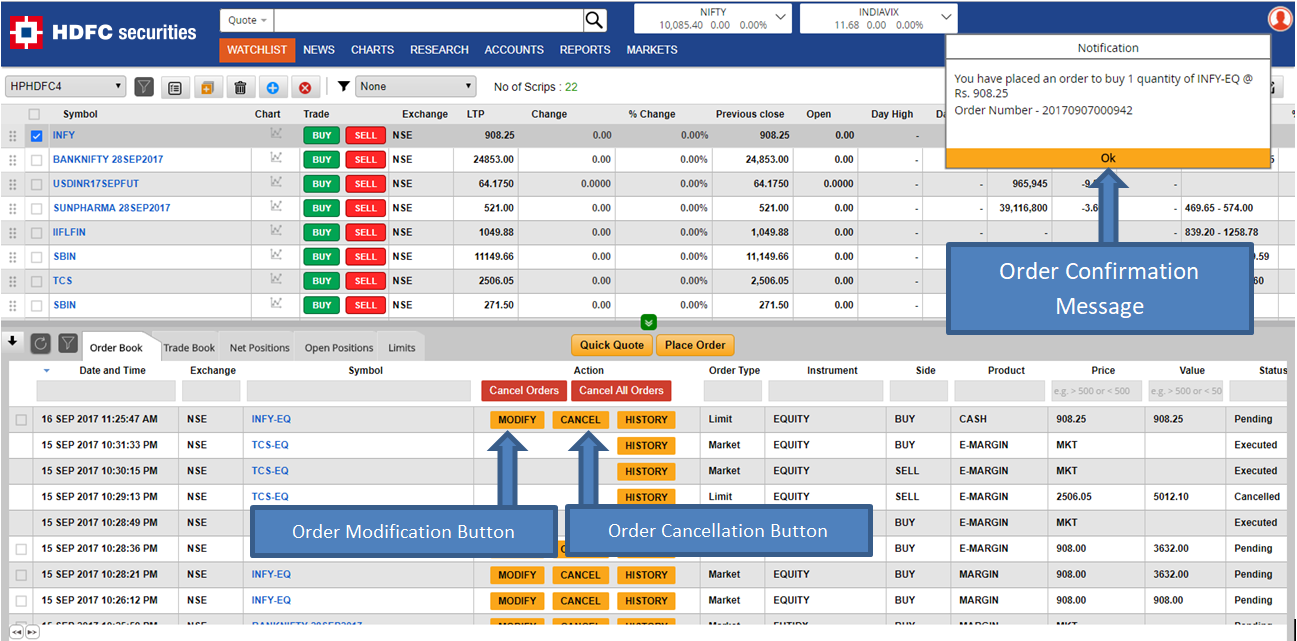
Option to modify or cancel open order/s is available in Order Book. You can use "Modify" and "Cancel" buttons for modification and cancellation of open order/s respectively.
Yes. Option to view order history is available in order book. You can simply click on "History" button to view history for that order.
You can refer Trade Book to view information about traded contracts.
The application allows user to convert or square off positions for the available quantities / lots.
- Position Conversion: Position/s can be converted fully in another product by simply clicking on "Convert" button available in Trade Book.
- Position Square off: One can square off the position/s by simply clicking on "Square off" button available in Net Positions.
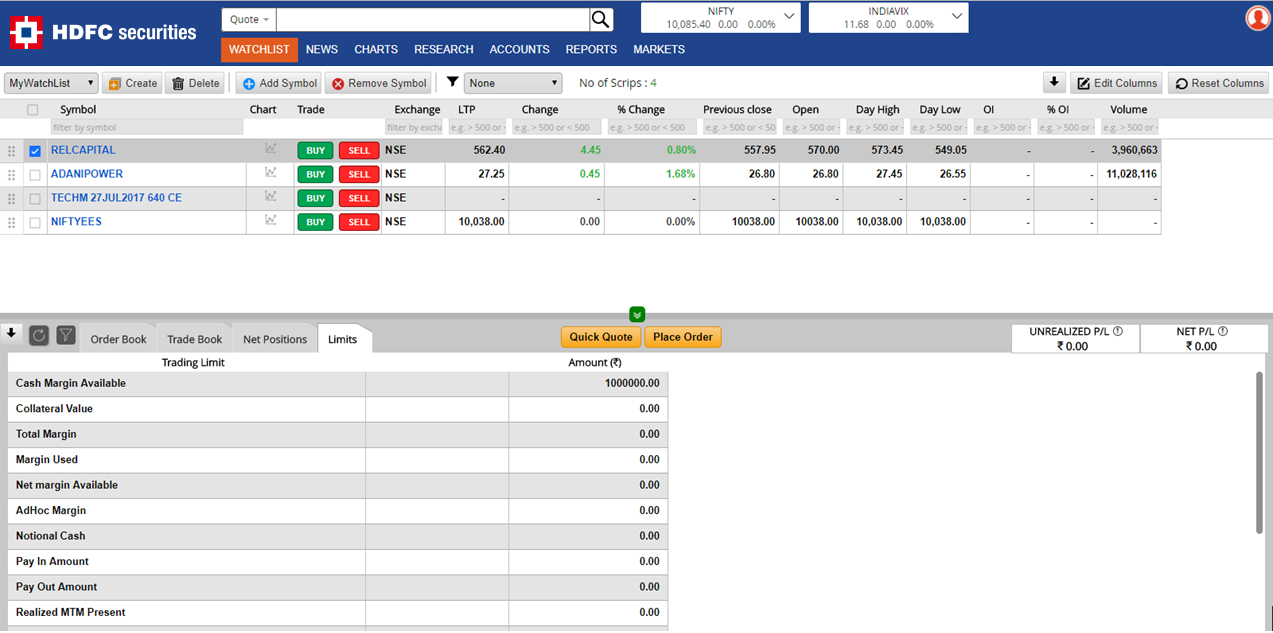
You can check trading limits by clicking on the Limits link in the panel bar available at the bottom of the screen. You can also check trading limits while placing an order.
Yes. In Order Book, open orders can be cancelled simultaneously. You can either cancel all open orders or cancel multiple open orders.
Watchlist
- Primarily there is a user defined watchlist. You can use "Create" button to build your own watchlist. You can also add / remove any symbol from the watchlist screen.
Yes. You can create multiple watchlists.
There are two ways for adding stocks, futures and options in user defined Watchlist:
- Click on the Add Symbol button and select the symbol / company of your interest.
- You can add the symbol / company directly from company page. You need to click on "+Watchlist" button, which is available at top left corner below company name.
There are two ways to remove stocks, futures and options from your Watchlist:
- Select checkbox for symbol/s that are no longer required in watchlist screen and then click on the "Remove Symbol" button.
- You can remove the Symbol / Company directly from company page. You need to click on "-Watchlist" button, which is available at top left corner below company name.
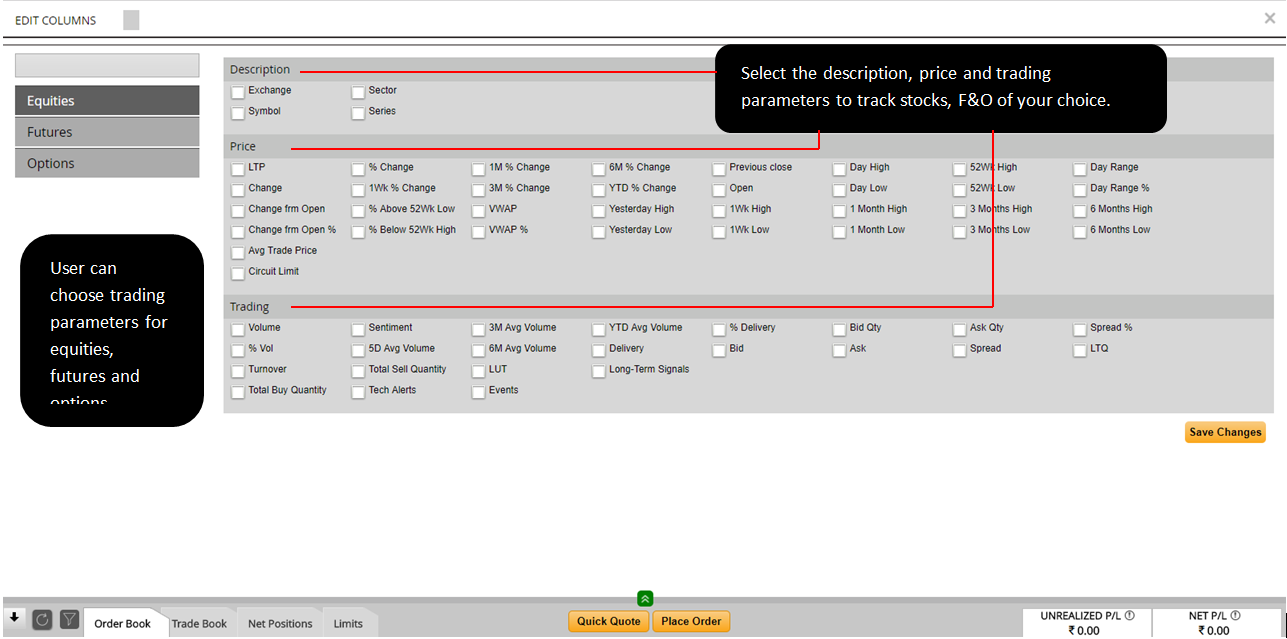
Watchlist screen provides a large set of parameters under "Edit columns". You can add or remove parameters by clicking on "Edit columns".
Yes. You can filter data available in watchlist columns using the text boxes given below each column header.
- For text values columns user can perform exact search.
- For numerical values columns user can use = (equal to), <= (less than or equal to),< (less than),>(greater than),>=(greater than or equal to) filters.
Predefined filters are available in watchlist screen. You can filter data for stocks, futures and options by Most Active, Price Gainers / Losers, Volume Gainers, OI Gainers / Losers, Long Built-Up / Short Built-Up etc. from the dropdown.
Yes. You can click on column header once / twice to sort the data in ascending / descending order.
Yes. You can delete the entire Watchlist by clicking on the "Delete" button in the Watchlist screen.
Company Overview
There are two ways for navigating to company overview page:
- You can simply click on the company name scrip from any watchlist for navigating to company overview page.
- You can use top search bar for navigating to company overview page.
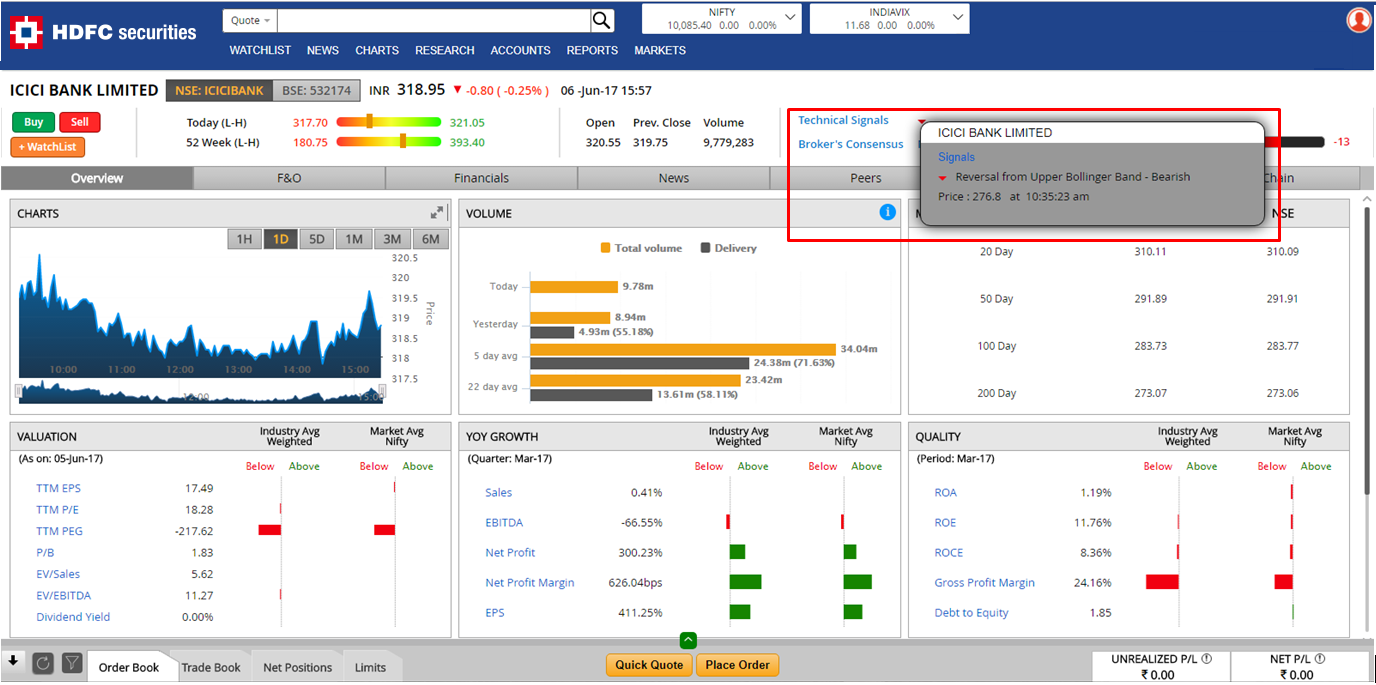
All listed companies on the NSE and BSE are available in company overview page. If the company is listed on both exchanges then user can navigate to another exchange by simply clicking on the NSE or BSE from the top ribbon.
A technical signal indicates whether the particular stock is in bullish or bearish zone. Technical signals are issued when particular stock breaks important levels on key technical indicators such as SMA, EMA, MACD, RSI, Bollinger bands etc.
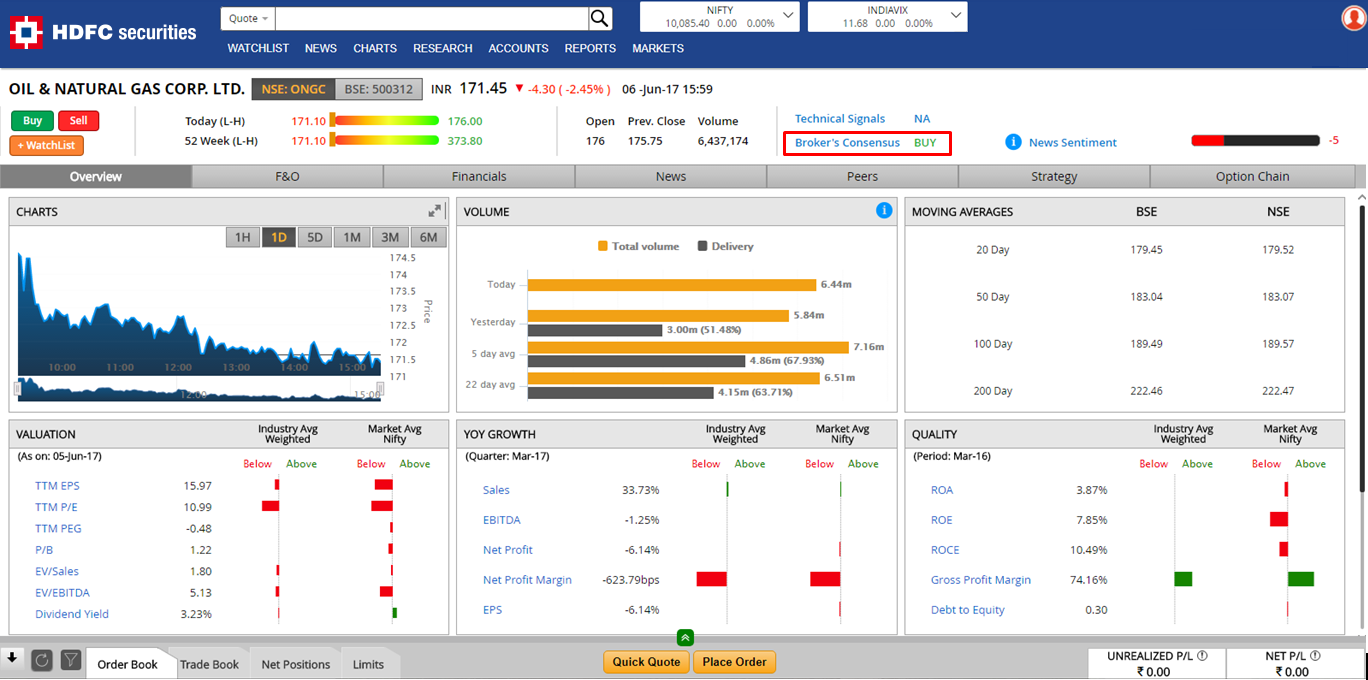
You can get broker’s view / rating (Buy, Sell, Accumulate etc.) on particular stock under Broker’s consensus.
News sentiment shows the sentiment for the company based on news flow during the past 24-hours window. It is calculated every 15-minutes. Sentiment can be positive on 0 to 100 scales or negative on 0 to -100 scales. It could also be neutral where sentiment is zero. If there is no news for a company during the past 24-hours then sentiment will be 0 by default.
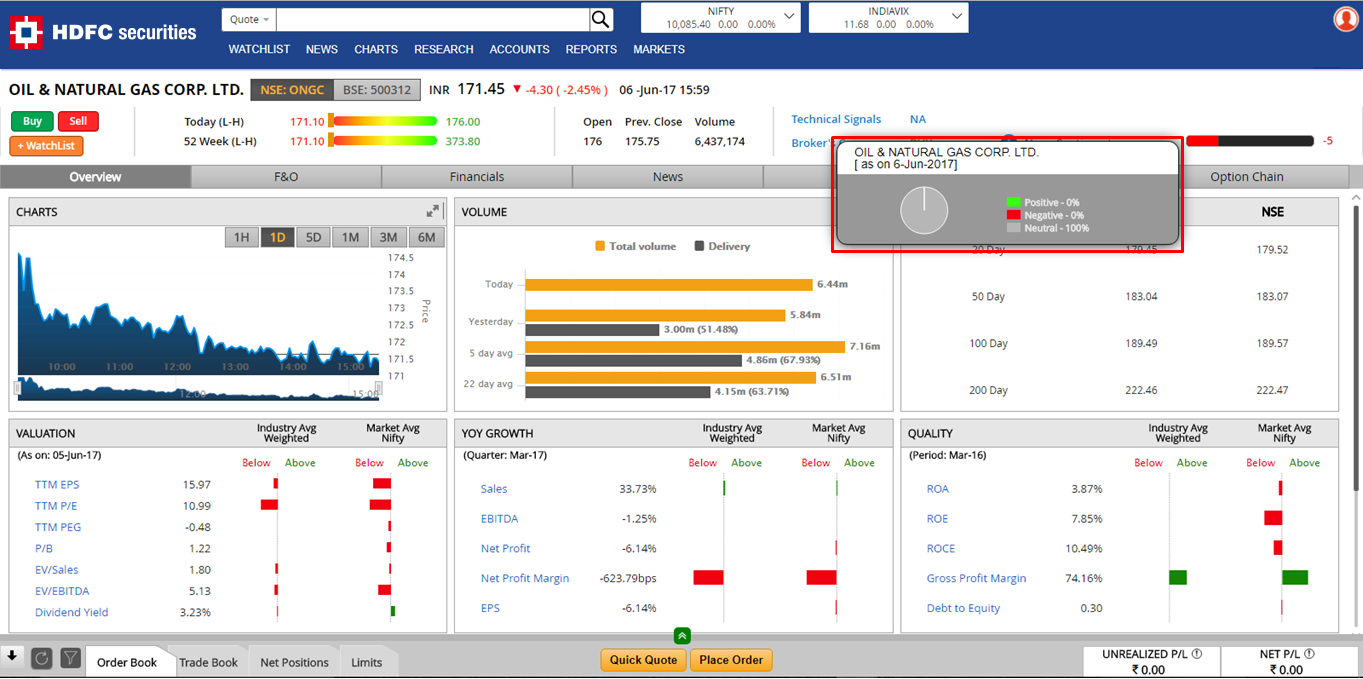
The news sentiment bar graph shows the breakup of “number of news” items in last 24-hrs. Count of news items is shown in green, red, neutral color in square box next to every news headline. For example, there could be 10 news items for company in past 24 hrs. 2 of which are neutral, 5 of which are positive and 3 is neutral. In this case positive pie will read 50% positive, 20% negative and 30% neutral.
Please note that having higher count of positive news does not mean sentiment score will be positive. News sentiment score is calculated based on combination of positive, negative and neutral news flow. If there are two news updates - one positive and one negative for particular company, then negative news will negate the impact of positive news flow. As a result, overall sentiment score would be lower due to impact of negative news flow. Therefore, one should not consider it as a signal to buy the stock.
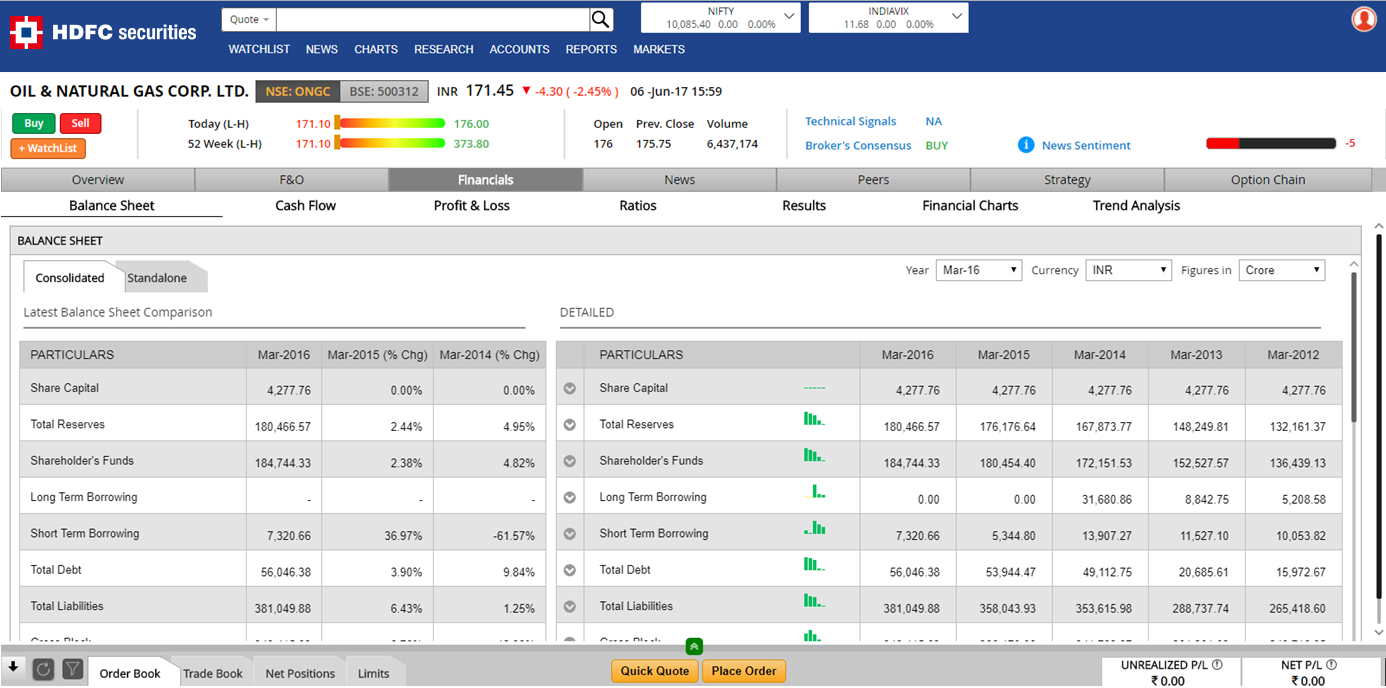
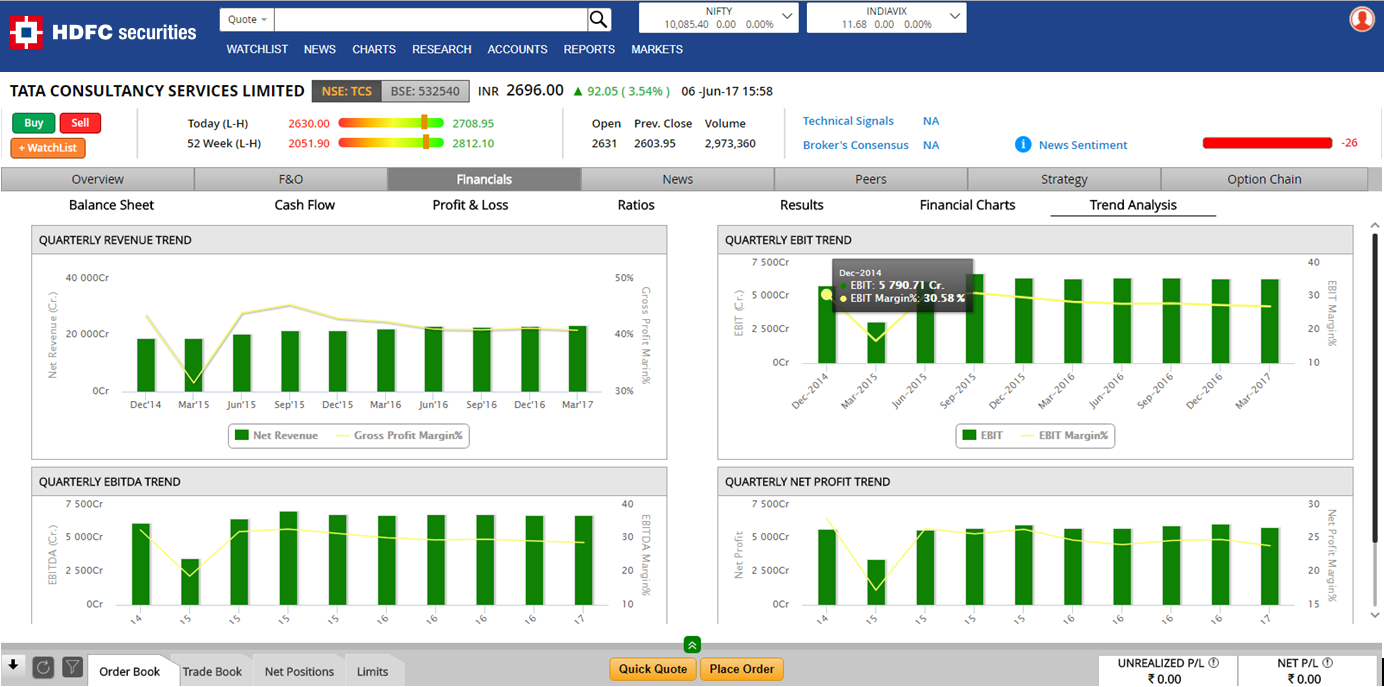
You can access detailed financial performance for any company by clicking on "Financials" tab. You can view and analyze Quarterly Results, Profit & Loss, Balance Sheet, Cash Flows and Ratios under "Financials" tab. You can also view Financial Charts and Trend Analysis for better analysis of trend through graphical presentation..
The Balance Sheet section shows the year-on-year accounting value of the company's assets, liabilities and shareholder's equity on both standalone and consolidated basis. You can choose between Currency (INR and USD) and Figures (Crore and Million).
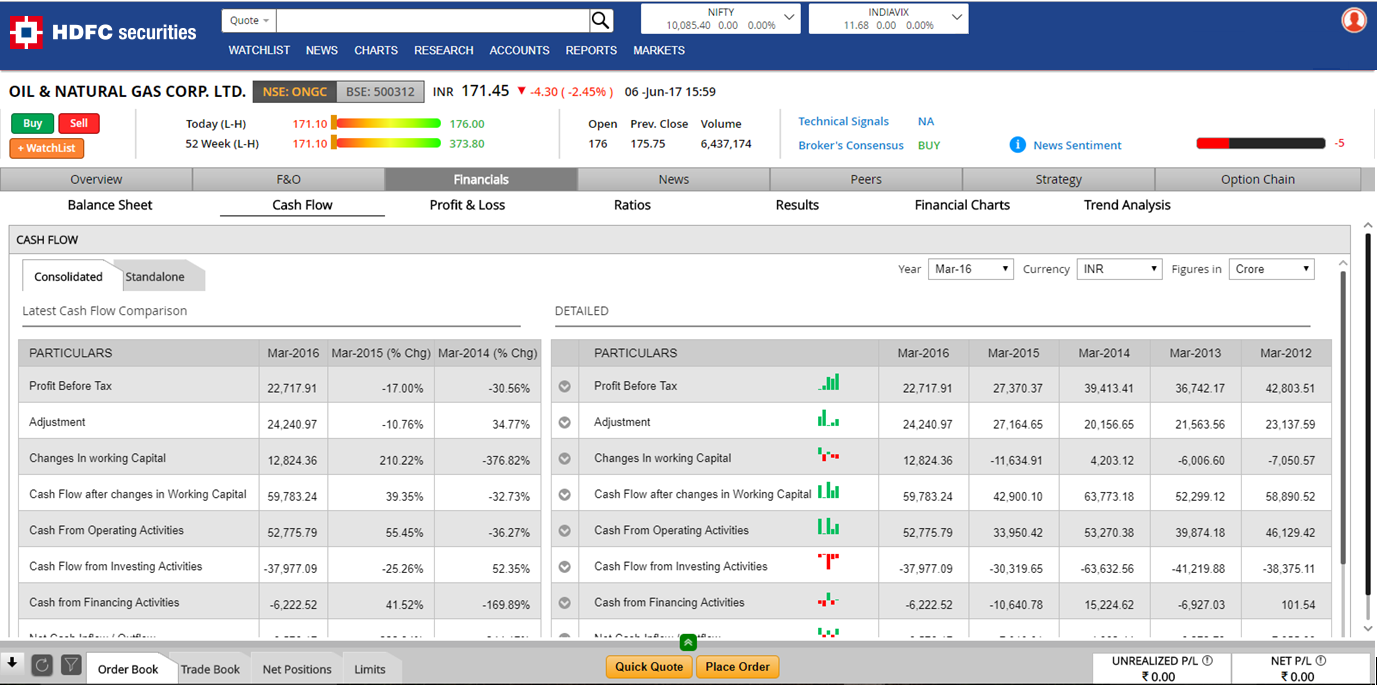
The Cash Flow section provides a year-on-year analysis of all activities of the company (Standalone and Consolidated) that affected the cash flow during the defined accounting period. Cash flow statement is divided into three categories: operating cash flow, investing cash flow and financing cash flow. Operating cash flows are those related to a company's operations, that is, its day-to-day business activities. Investing cash flows relate to its investments in businesses through acquisition; in long-term assets, and in securities. Financing cash flows relate to a company's investors and creditors: dividends paid to stockholders would be recorded here, as would cash proceeds from issuing bonds. You can choose between Currency (INR and USD) and Figures (Crore and Million).
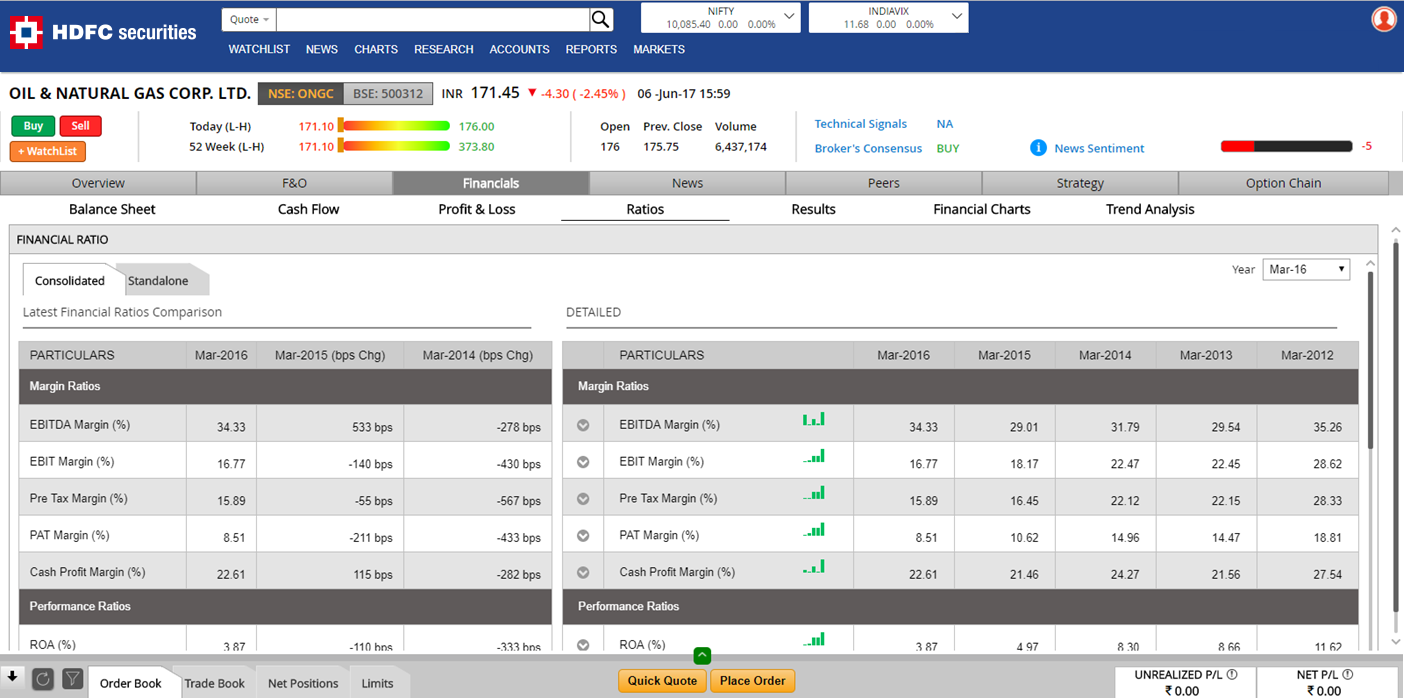
You can use Ratios screen for evaluating various aspects of a company's operating and financial performance such as its efficiency, liquidity, profitability and solvency. The ratios are categorized as - Margin Ratios, Performance Ratios, Growth Ratios and Financial Stability Ratios. Ratios are calculated from the reported figures in the financial statements (Standalone and Consolidated).
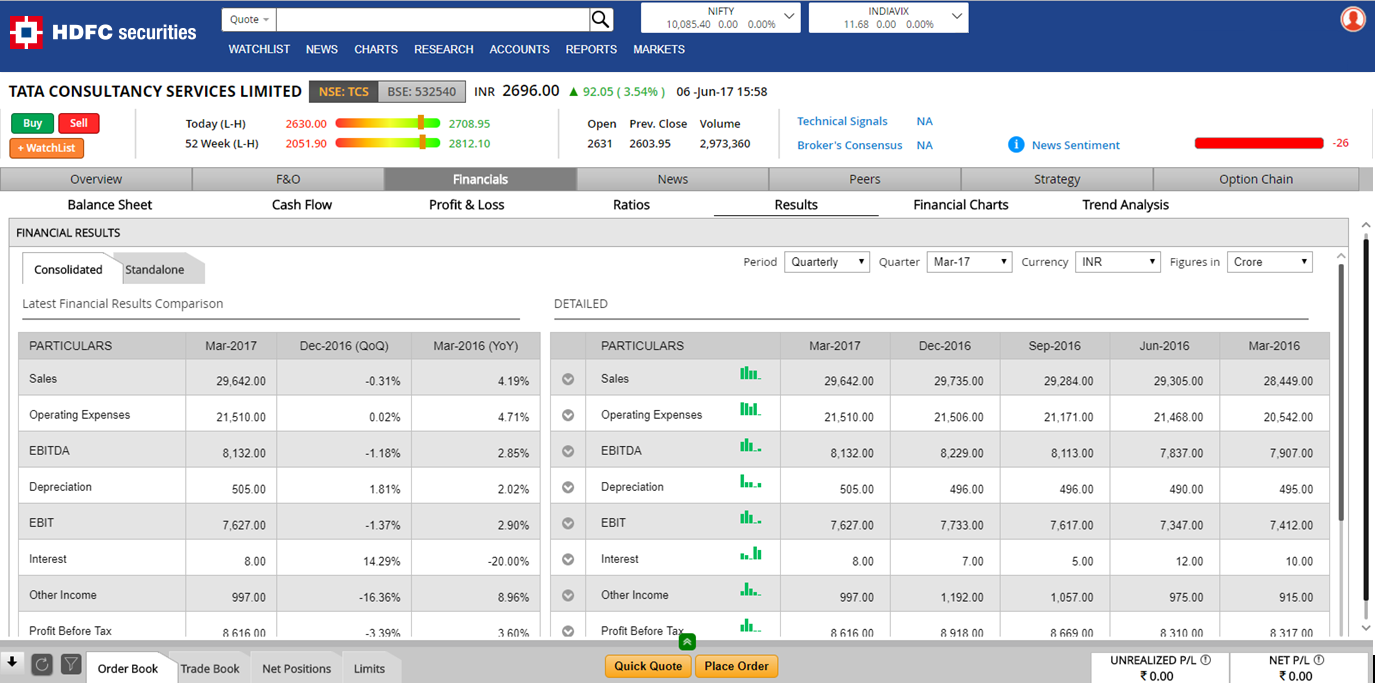
The Results section lets you compare the financial performance of the company (standalone and consolidated). You can review Results based on your preferred time period – Quarterly, Half-Yearly and Annual. You can also choose between Currency (INR and USD) and Figures (Crore and Million).
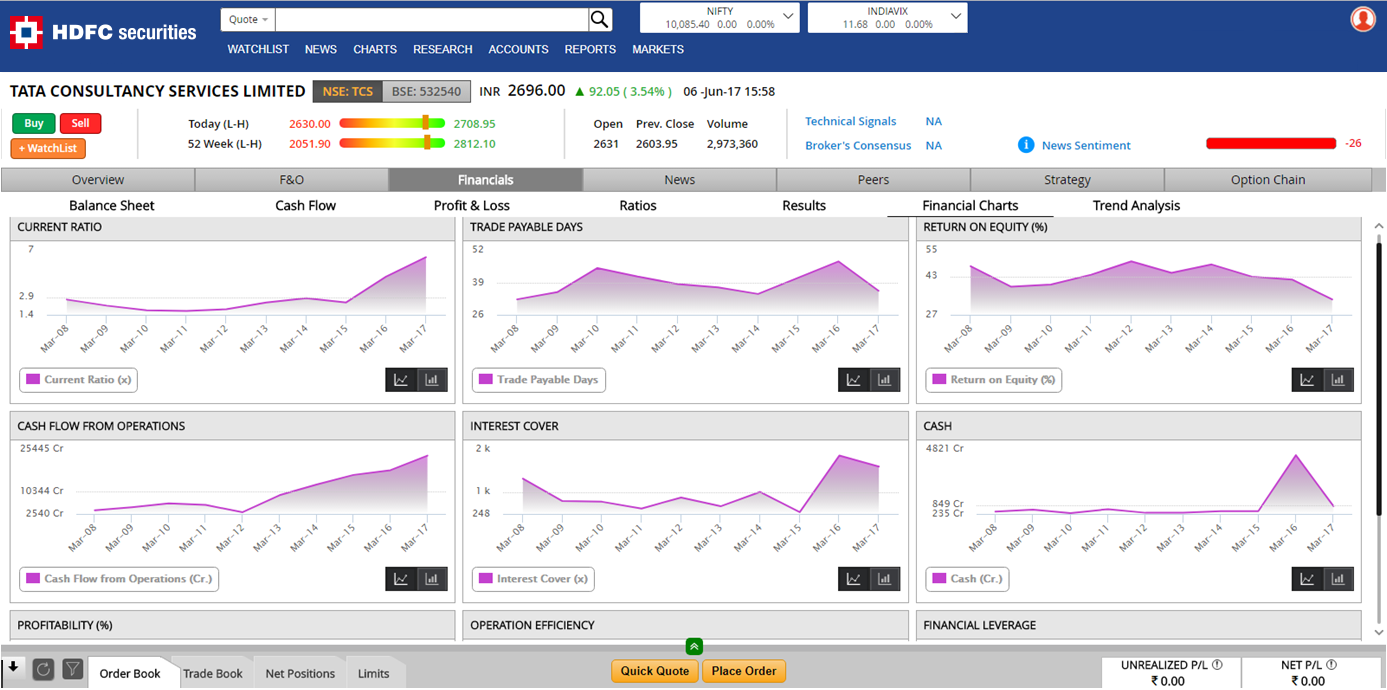
Financial Charts screen will help you in understanding trend for key operational indicators. This screen depicts movement in Current Ratio, Trade Payable Days, Return On Equity (%), Cash Flow From Operations, Interest Cover, Cash, Profitability, Operational Efficiency and Financial Leverage in charts for the past 10-years.
Trend Analysis screen will help you in understanding trend for quarterly financial performance on key indicators. This screen depicts movement in Quarterly Revenue, EBIT (Earnings before income tax), EBITDA (Earnings before interest, tax, depreciation and amortization) and Net Profit in charts for the past 10-quarters.
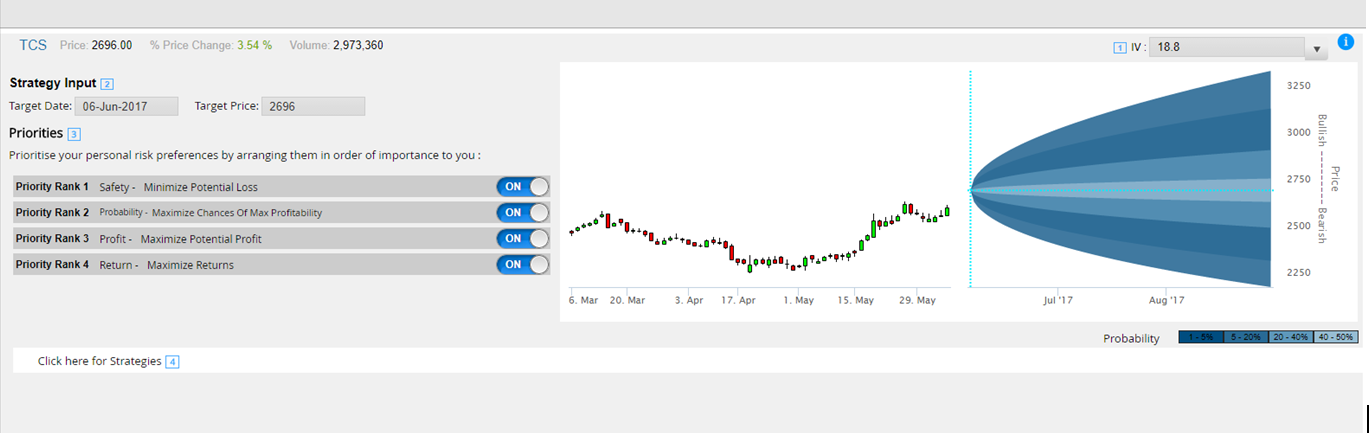
Strategy screen not only allows you to analyse probability for price forecast, but also evaluates various options strategies based on your risk and reward preferences. Strategy screen consists of following:
- Probability Chart: It shows the forecast of future price by taking the implied volatility (IV) as input to lognormal distribution and plotted over time. The current IV is taken as default. However, the user can define his own IV or select from dropdown if he/she thinks the IV may fall/rise going ahead. The price forecast is a reflection of the user’s view of the IV. The plot then shows the probabilities of stock price achieving those prices on that particular date.
- Strategy Input: This gives you an option to select target price and date for your strategy.
- Priorities: This allows you to prioritize personal risk preferences based on Profit, Safety, Probability and Return. You can move the field bars up or down based on your preference. Based on user's strategy input and priorities, our system generates up to 5 options strategies taking the real-time values of puts and calls. You can also view risk/ reward for each strategy.
After filling in Strategy Input details and choosing your risk preference, you can select "Click here for Strategies". The system scans through all possibilities for the given risk preferences and gives the most optimal options strategies taking the real-time values of puts and calls. The risk profile shows the profit with respect to the price on that date. The system also allows you to review risk/reward and payoff diagram for each strategy.
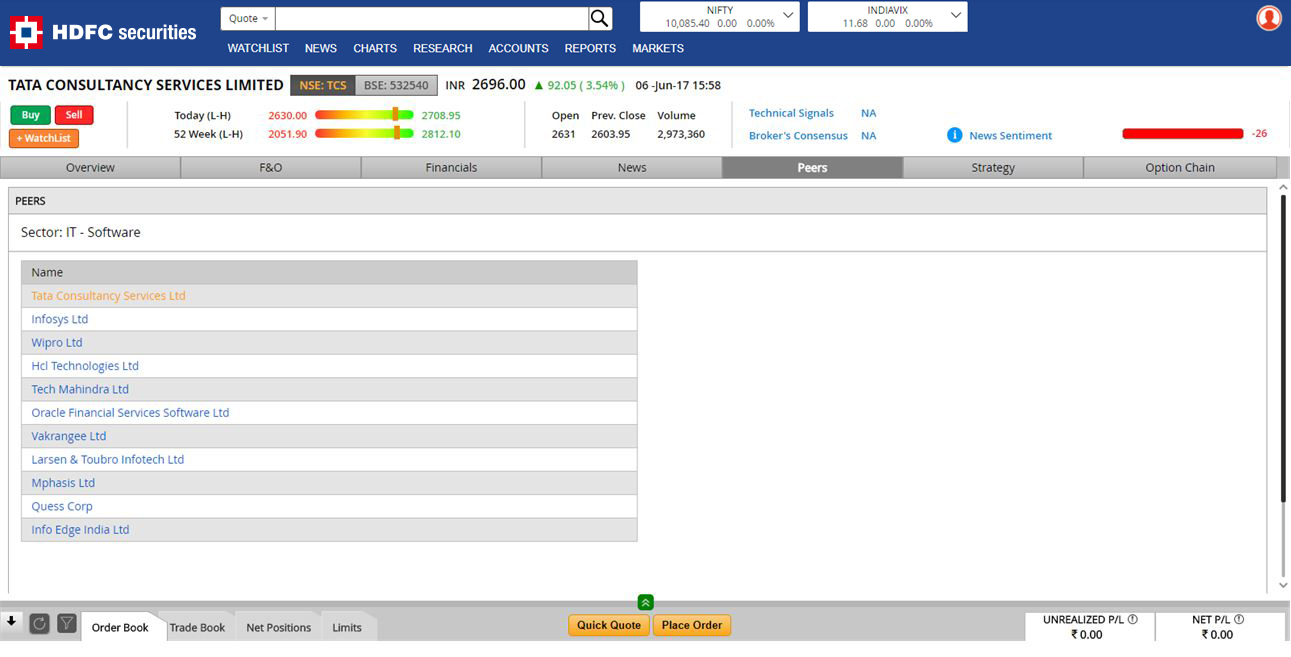
Peers screen will help you to identify the competitor companies within same industry.
Research
A screener is a filtering tool to analyze stocks universe in a customized manner. Finding a multi-bagger out of thousands of stocks is a daunting task if one would have to go through financials of each company listed on exchanges. In order to succeed in the long term, one needs to have a sound and discipline investment strategy based on underlying fundamentals. One can save time, energy and also spot the right opportunity quickly by filtering large chunk of datasets and boil down the stocks based on your investing or trading style. Screeners help you make investment decisions by validating the information rather than simply investing based on rumors. The most important aspect of a screener is to narrow the list of stocks research by removing outliers and concentrate on few stocks for further in-depth research. Our screeners display performance chart of each screener and how they have fared on daily basis. A screener portfolio is built based on equal weightage stocks satisfying the criteria and the portfolio is rebalanced on a daily basis. So if you want to see which screener has given maximum returns, you can simply get it in one click by sorting it and find the best performing screener in a particular time interval. You can find this option by clicking on the Research section and selecting Screeners from the dropdown menu.
News
Our news application keeps tab on millions of sources globally to capture updates on corporates, currency and global markets in real-time. Our revolutionary technology – sentiment analysis, news tagging & clustering and discovery engine – does all the heavy lifting for you and helps you make sense of millions of raw news data points. Trending News widget monitors white-label media houses globally in real-time to source news updates on all listed companies in India. Streaming News widget captures tweets of trusted twitter handles in real-time so that you can have instant access to corporate news/ updates. We have segregated news into the following categories.
- Equity News – This covers Trending News, Streaming News, Corporate Announcements, Recommendations and Transaction Details.
- Currency News – This covers Institutional View, Trending News and Streaming News of major currency pairs.
- Global Market News – This provides news for all the leading Global Markets along with the Global Map View.
Yes. You can get views and recommendations from brokers / experts in Recommendations widget under news screen.
You can view management as well as institutional transactions in the company's shares under Transactions - Bulk Deals widget. You can also get the additional information such as quick facts such as largest transaction, largest stake holder etc. related to scrip and any major activity which occurs in the market related to the scrip; also user can view the last 2 years bulk deal details through the chart displayed at top. You can find this widget on below two places:
- Main news screen
- Company overview page --> News screen
The sentiment – price chart shows how news sentiment score has moved in tandem with share price. In expanded view, you can also view events and sentiment news which contributed rise or fall in sentiment score.
Yes. You can get suggestions of stocks from brokers / experts and social media by selecting Recommendations from news section.
Charts
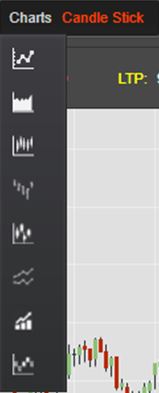
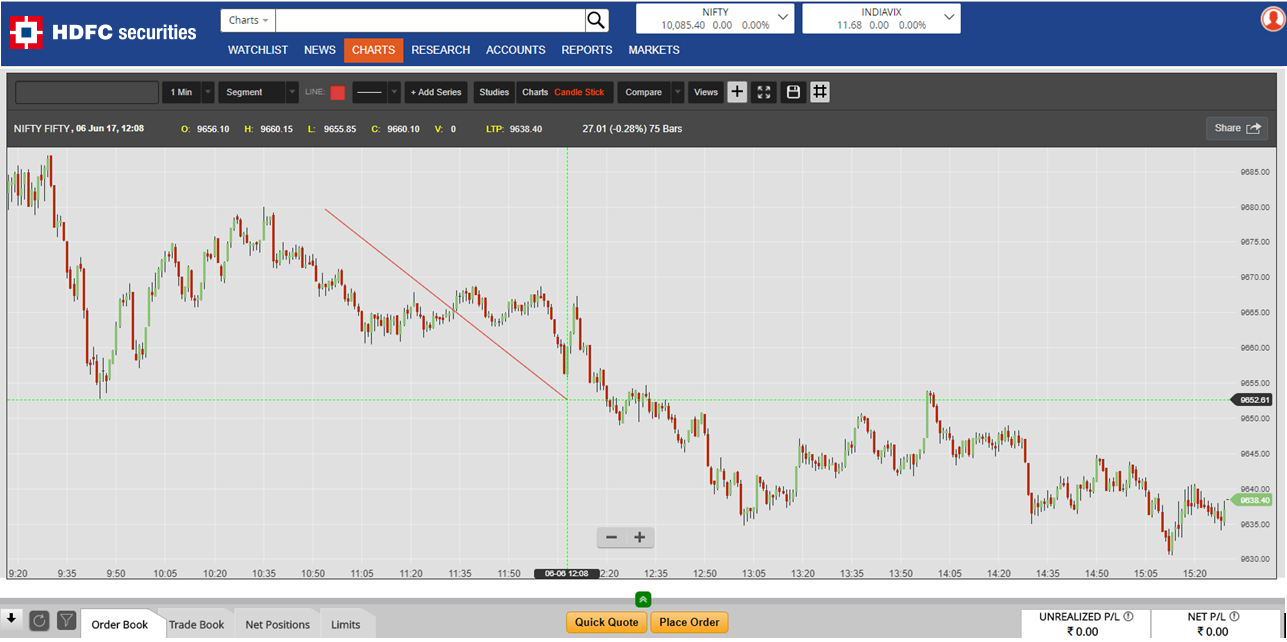
You can view 8 different types of charts using "Charts" dropdown. Line, Area, Candlestick, OHLC, Heikin-Ashi, Line Break, Range Bars and Renko are the chart types available for analysis
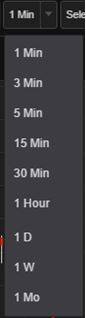
You can view chart on multiple timing intervals (1 Min, 3 Min, 5 Min, 15 Min, 30 Min, 1 Hour, 1 Day, 1 Week and 1 Month). Please note that 1 minute charts are displayed by default.
You can use 18 different types of drawing tools under "Select Tool". These drawing tools are Crosshair, Segment, Continuous, Ray, Line, Horizontal, Vertical, Rectangle, Ellipse, Measure, Channel, Doodle, Fibonacci, Gartley, Pitchfork, Annotation, Callout and Shape. Crosshairs are automatically enabled whenever a drawing tool is active. Select any drawing tool and then draw it on chart. Tap twice to abandon the drawing. To delete a drawing using mouse, highlight the drawing and then right click. On touch devices, highlight the drawing and then tap twice or press the trash icon that appears when the drawing is highlighted.
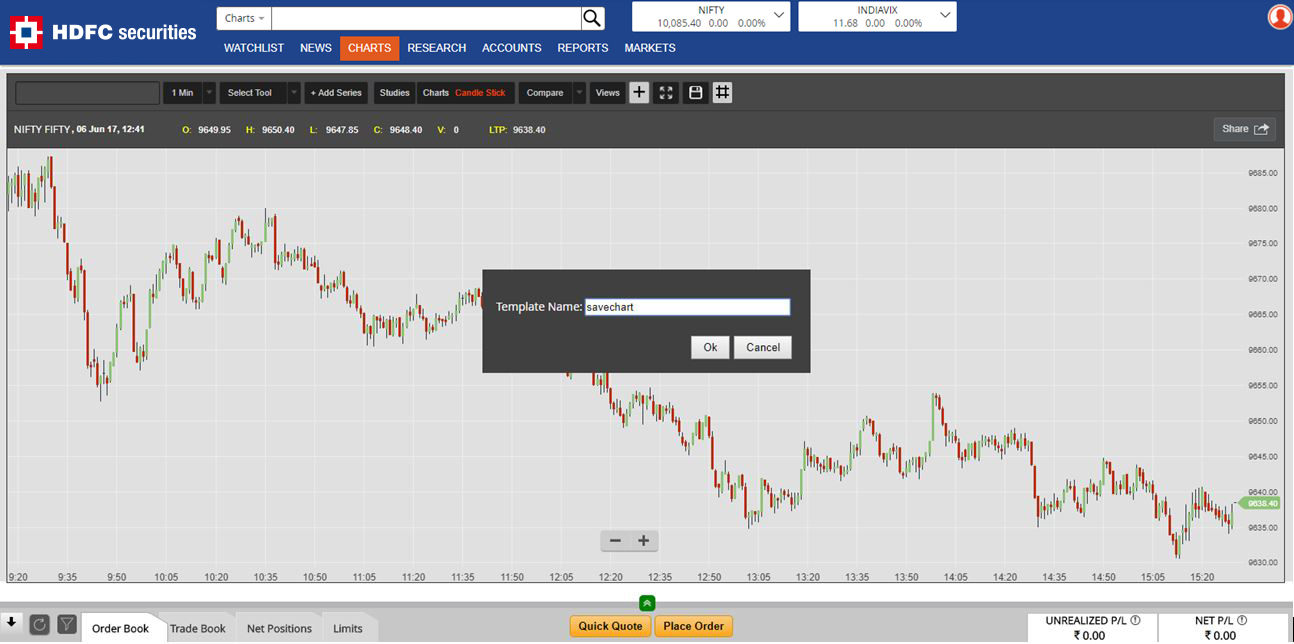
You can save technical studies and duration used for plotting a chart with the help of "Save Views" icon. This will help you to use saved view as a template to perform same technical analysis on any other stock in future. Saved view can be viewed using "Views" button. User can delete the view using the delete icon given in front of the view name.
There are multiple ways to access the advanced charting tools.
- Select Charts from the top search textbox and search for the scrip or the contract name.
- Click on the
navigation menu. By default, NIFTY index charts would be displayed. Type the script or the contract name in the search box available on the charts page to view charts of particular scrip. - From the top search bar, go to the company or index overview page. The widget for charts can be expanded to view the advanced charting feature.
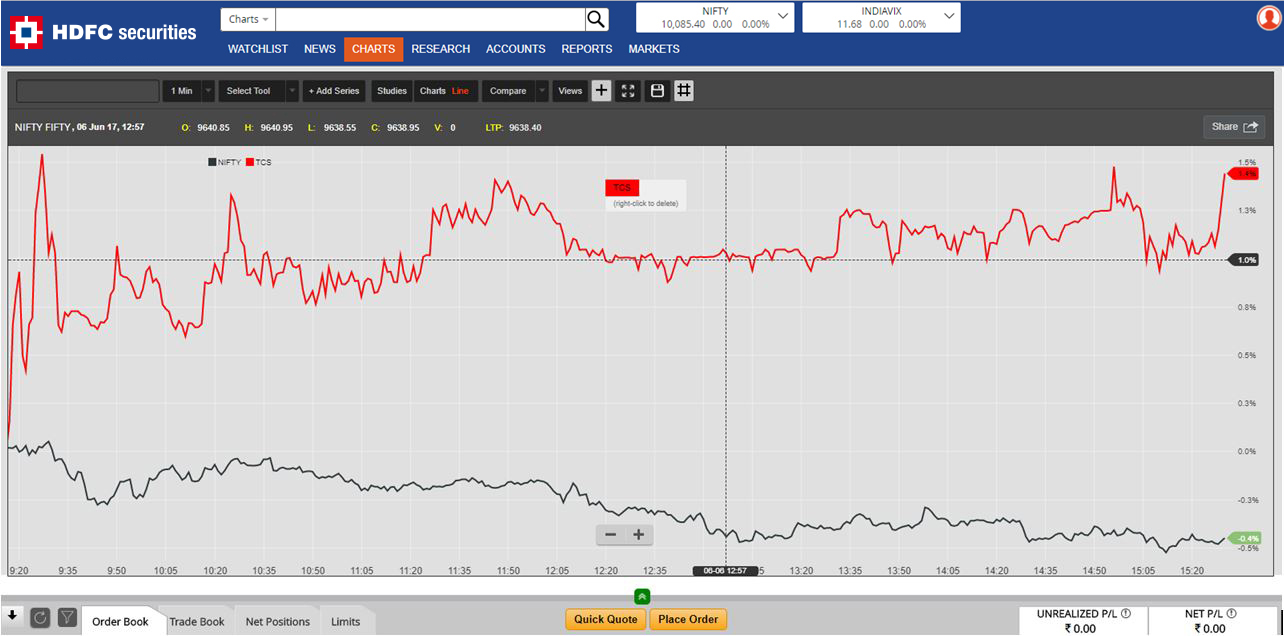
Compare charts feature allows you to compare any scrip of equity or F&O with another stock/s. User can compare 2 symbols chart at a time. You can view chart in two types - line and mountain.
Hover on the "Studies" dropdown to perform basic as well advanced technical analysis. Moving averages, RSI, Stochastic, Bollinger Bands and 25 other studies can be easily performed using our chart screen. Studies can be of two types - panel and overlay. Panel studies appear stacked in windows below (or above) the chart. When multiple panel studies are active, they can be repositioned by pressing the "up" or "down" icons. Study settings for panel studies can be modified by pressing the "gear” icon. Press the "X" icon on a panel to remove it and destroy its underlying study. The size of panels can be changed by dragging the horizontal borders. It is possible to annotate and create drawings on panels. Overlays (and underlays) are studies that are superimposed over the chart itself. Hovering over the line or shapes that make up a study will highlight that study. Right click a highlighted overlay to get a context menu that allows editing and deleting. On touch devices, highlight the study by tapping it, then tap the trash can icon to delete or the cog icon to edit.
- You can directly place order using "Buy" and "Sell" buttons available on Charts screen.
- Screen controls are provided to pan the view (left and right keys). The home will take you back to the end of the chart (the latest bar).
- Screen controls are provided to zoom in and out (plus and minus keys / up and down keys) or the mouse wheel may be used to zoom. Users can also grab either axis to zoom in or out (compress the axis).
- You can use crosshairs option on top bar to enable and disable the crosshairs on charts.
- You can view the charts in expanded view or normal view using the expand option.
- You can use gridlines option to enable or disable the background grid view on charts.
- You can share charts by simply clicking on the 'Share' button located on the upper right hand corner of the screen. You can also view chart in new window by clicking on "Open shared chart in new window".
Shortcut Keys
Yes. Shortcut keys are available to simplify trading activities.
- Buy Orders can be placed using "F1" and "+" keys.
- Sell Orders can be placed using "F2" and "-" keys.
- Market Depth for particular scrip can be viewed by pressing "F6".
- Other shortcut keys available are:
- Order Book - F3
- Trade Book - F8
- Net Positions - F11
Yes. Stocks can be selected using up and down arrow keys or using mouse click in watchlist. The first stock in the watchlist would be selected by default and then the user can change the selection using the arrow keys. Once the stock is selected the user can use shortcut keys like F1 and F2 to place orders.
Market Analytics
You can arrive at the equities screen by selecting "Equities" in the dropdown menu under "Trading" tab. You can get a comprehensive analysis of equity markets.
Overview: This screen offers option to view Corporate Actions, News Pulse and Screeners.
You can open F&O by selecting FNO in the dropdown menu under "Trading" tab. You can get a comprehensive analysis of F&O markets.
Overview: This screen offers option to view FNO Pulse, 15-minutes Built-up, FNO Alert and Screeners.
15-Minutes Built-up: This screen gives a snapshot of every 15 minutes of whether the long or short positions were created in a particular stock or an index. It analyses the open interest position in real time and gives a breakup of fresh and square-off contracts along with volumes.
Market: You can access the following information in Market screen:
- Option Chain: Put / Call Chain view provides a comparison between Price-Nifty, OI-Nifty, Volume-Nifty and IV-Nifty. Option Chain view provides options prices of all options contracts for the underlying. You can select and view different option contract parameters in the option chain. By default, NIFTY’s option contract is displayed in this screen. However, you can view option chain for any scrip for near, next and far month contracts. Moreover, you can view option chain in grid as well as in chart.
You can track movement in global indices. To get updates on global indices, you need to select FNO in the dropdown menu of the "Markets" section and then navigate to the Indices tab available on the left navigation pane.
Strategy screen not only allows you to analyses probability for price forecast, but also evaluates various options strategies based on your risk and reward preferences. To access this screen, you need to click on Strategies tab available on the left navigation pane of FNO section. Strategy screen consists of following:
- Probability Chart: It shows the forecast of future price by taking the implied volatility (IV) as input to lognormal distribution and plotted over time. The current IV is taken as default. However, the user can define his own IV or select from dropdown if he / she thinks the IV may fall / rise going ahead. The price forecast is a reflection of the user’s view of the IV. The plot then shows the probabilities of stock price achieving those prices on that particular date.
- Strategy Input: This gives you an option to select target price and date for your strategy.
- Priorities: This allows you to prioritize personal risk preferences based on Profit, Safety, Probability and Return. You can move the field bars up or down based on your preference. Based on user's strategy input and priorities, our system generates up to 5 options strategies taking the real-time values of puts and calls. You can also view risk/ reward for each strategy.
Option Calculator allows user to calculate theoretical option premium price in real-time and take advantage of the price mismatch happening in current market. User can navigate on this page, by heading to FNO analytics page by selecting the F&O link in the dropdown menu of the Trading section and navigating to the Option Calculator tab available on the left navigation pane. Fill in the required details and click on Submit.
15-Minutes Built up Screen is a unique tool in our FNO analytics designed to spot price trends in real-time. This screen gives a snapshot every 15 minutes of whether the long or short positions were created in a particular stock or an index. It analyses the open interest (OI) position in real time and gives a breakup of fresh and square-off contracts along with volumes.
15-Minutes built up tool analyses the change in OI tick-by-tick in a session (15-minutes) and records how many fresh positions were created or squared off in that interval. It also takes into account the price movement of every tick in the same period along with the volumes to infer various scenarios.
Interval: An interval is a 15-minutes session that analyses price, OI and volume. In a trading session, there will be 25 intervals starting from 9.15 am to 3.30 pm.
Zone: Zone analyses the data and indicates five scenarios – Long Built Up, Long Unwinding, Short Built Up, Short Covering, and Neutral. One should look at zones closely to see whether a sustained buying or selling is happening in a particular counter along with the rise in volumes and fresh / square-off contracts.
Price Zone: It indicates the low and high price of a particular counter during 15-minutes interval.
Fresh / Square-off: Fresh records new positions that were created today in a particular interval (long or short). Square-off indicates how many positions (intraday/positional) were squared off in the same interval.
Traded Contracts: It suggests the volume in a 15-minutes session. A trader should look at volumes closely and see any rise in volumes along with rise in fresh contracts suggesting strong buying or selling.
Put/Call Chain view provides a comparison between Price-Nifty, OI-Nifty, Volume-Nifty and IV-Nifty. Option Chain view provides options prices of all options contracts for the underlying. You can select and view different option contract parameters in the option chain. By default, NIFTY’s option contract is displayed in this screen. However, you can view option chain for any scrip for near, next and far month contracts. Moreover, you can view option chain in grid as well as in chart. To view the Option Chain, navigate to F&O link available under trading section. Expand the Markets tab available on the left navigation pane and click on Option Chain. By clicking on the Market link, you can access the Put Call chain and Option chain.